The Business Case for Monitoring: Uptime, Errors, and Real User Performance
Why small businesses need website monitoring — uptime, errors, and real user performance — and how to set it up without paying for an enterprise stack.
The hardest outage to recover from is the one a customer tells you about. By the time someone takes the trouble to email you that the contact form has been broken for a week, you have already lost the leads you would have otherwise captured, and you have undermined the trust of someone willing to give you the benefit of the doubt long enough to write a message.
Monitoring exists so that you find out before the customer does. The reason most small businesses do not have it is not that monitoring is hard — it is that the conversation is dominated by enterprise tooling and pricing that makes it sound out of reach. It is not. A useful monitoring setup for a small service business costs somewhere between zero and fifty dollars a month, takes a few hours to wire up, and quietly pays for itself the first time it catches something.
This post walks through what to monitor when you are small, which categories of tools matter, and how to avoid the alert fatigue that ruins most monitoring stacks within six months.
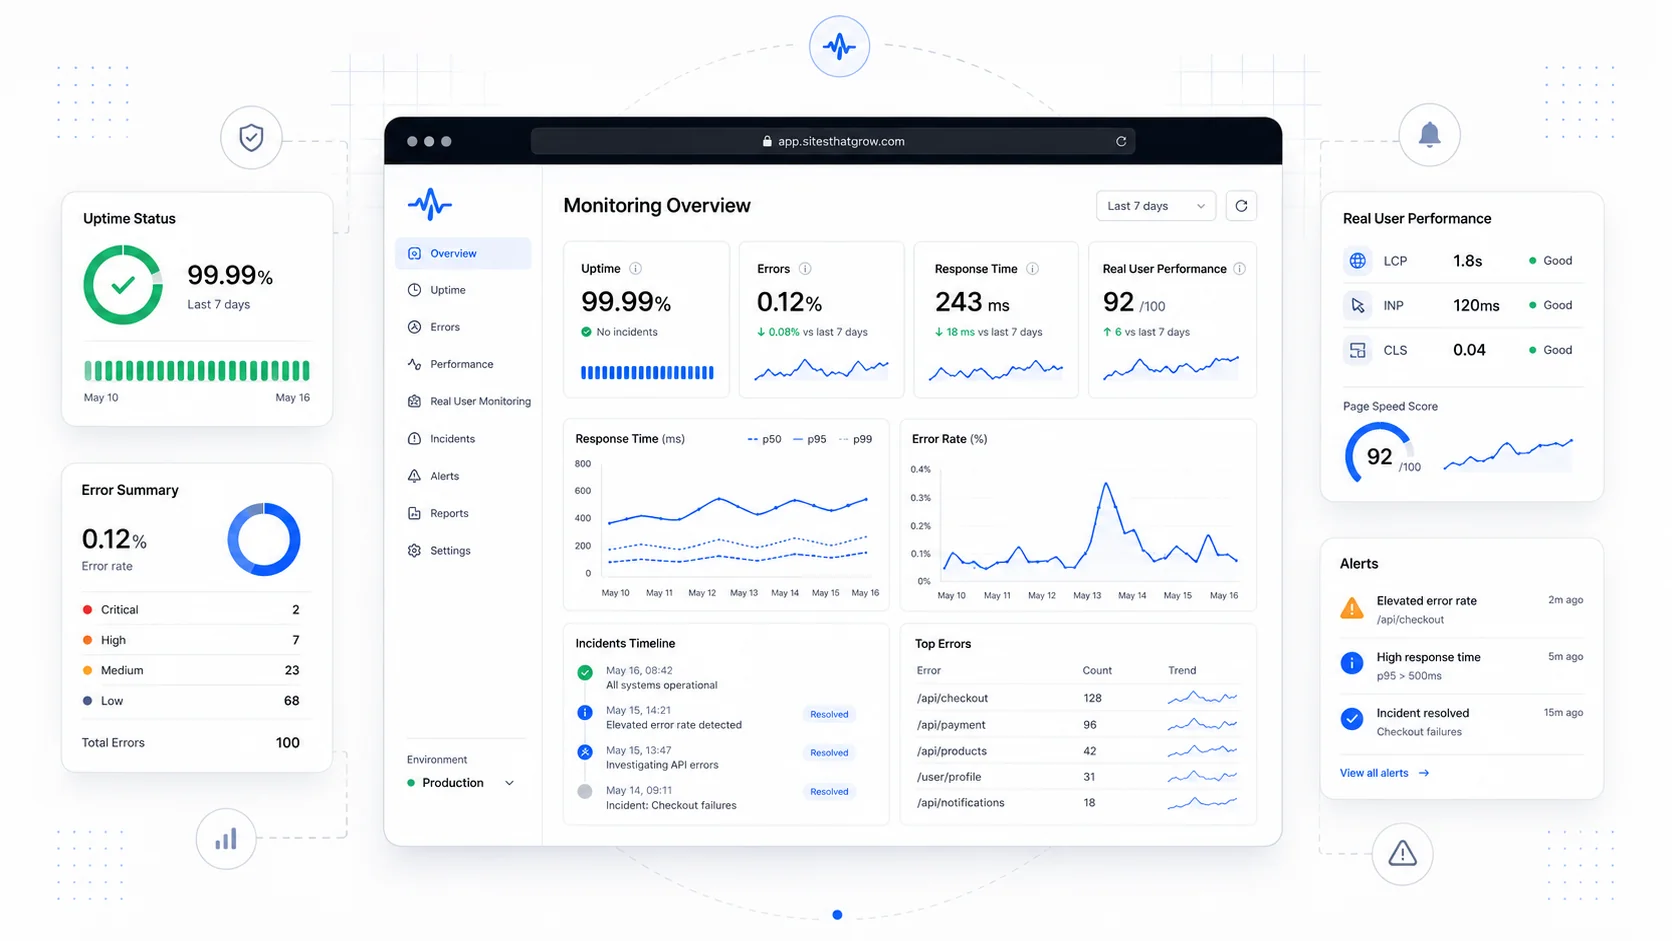
The Three Things Worth Monitoring
A small business site does not need observability. It needs to know three specific things:
- Is the site reachable? (Uptime)
- When users do things, do those things work? (Errors)
- How does the site actually feel for the people using it right now? (Real User Performance)
Every other metric is downstream of those three. Get them right and you have most of the practical visibility you need.
Uptime: did the page load at all?
Uptime monitoring is the simplest layer. A monitoring service hits a URL on a schedule from one or more locations and tells you when it stops responding correctly. The default is usually a 1- or 5-minute interval against your homepage with a check that the response is HTTP 200 and contains a string you expect.
The credible options:
- Better Stack (formerly Better Uptime) — clean UI, generous free tier, built-in incident management.
- UptimeRobot — a long-running budget option with a free tier that covers most small business needs.
- Pingdom — older, more enterprise-priced, still solid.
- Cloudflare Health Checks — built into the platform if you already use Cloudflare.
What to monitor at a minimum:
- The homepage.
- The contact or lead-capture page.
- A canary URL that exercises a real database query (for a service business, often the "services" page).
- Any subdomain customers depend on (
booking.,app.,status.).
What to skip: monitoring every page on the site, monitoring marketing landing pages with hourly precision, paying for SMS alerts on every check from every region.
Errors: did the user's action succeed?
Uptime monitoring tells you the page loaded. Error monitoring tells you whether the things on that page actually worked when a user interacted with them.
The category leader is Sentry, which captures JavaScript errors from the browser and server-side errors from most modern frameworks. The free tier is generous enough for most small business sites. Better Stack and Datadog cover similar ground. For Vercel-hosted sites, Vercel Observability catches a lot of the same data without separate setup.
What to capture:
- Unhandled JavaScript exceptions in the browser.
- Form submission failures (your form posts to a server endpoint — that endpoint should report when it fails).
- API errors from any third-party integrations the site depends on (payment processors, calendar systems, email senders).
- Server-side exceptions from your CMS or framework.
The single biggest payoff: catching the form that "broke last week" within minutes of the deploy that broke it, rather than three months later when a customer writes in.
Real User Performance: how does it actually feel?
Real User Monitoring (RUM) measures performance from the perspective of the people actually visiting your site, on their actual devices and connections. It is the only honest answer to "is the site fast?"
Your existing tools probably already do this. The Chrome User Experience Report (CrUX) collects field data from real Chrome users and feeds Google Search Console's Core Web Vitals report. That is RUM, and it is free.
If you want more granularity, the credible RUM products:
- Vercel Speed Insights — built into Vercel, surfaces Core Web Vitals broken down by page and device.
- Cloudflare Web Analytics — privacy-friendly, no cookies, includes Core Web Vitals.
- New Relic Browser or Datadog RUM — enterprise-grade, more depth, more cost.
- SpeedCurve — focused specifically on web performance, popular with engineering-heavy teams.
For a small business, Search Console plus the platform's built-in RUM (Vercel, Cloudflare, etc.) is usually enough.
Synthetic vs Real User Monitoring
A common point of confusion: synthetic monitoring (uptime checks, scripted browser tests) and real user monitoring (RUM) measure different things, and you usually want both.
- Synthetic runs on a schedule from a known location with a known browser. It tells you if the site works under controlled conditions. Good for catching outages and regression.
- RUM captures what real users actually experience. It tells you if the site works for the long tail of devices, connections, and behaviors you cannot script.
If your synthetic check is green but RUM shows your 75th percentile LCP at 6 seconds, your site is broken for a quarter of your visitors and your synthetic check just does not see it. The reverse — RUM is fine but synthetic catches an outage — happens when an issue is brief or affects a specific path.
Web.dev's RUM overview is a good orientation if you want to dig deeper.
Status Pages: Communicating Outages
When something does break, a status page is how you tell customers without forcing them to wait on hold. The bar is low: a separate URL, hosted somewhere unrelated to your main infrastructure, that shows current status and a history of past incidents.
Options:
- Better Stack Status Pages — included with their uptime monitoring.
- Statuspage by Atlassian — the original, enterprise pricing.
- Instatus — clean and inexpensive.
- Cachet — open source, self-host if you really want to.
For a service business with no SaaS product, a status page is overkill on the day-to-day but invaluable during a real incident. Even a static page hosted on a separate provider that you can update manually beats nothing.
Avoiding Alert Fatigue
The single most common failure mode of monitoring is that the team installs everything, gets paged constantly for trivial issues, and within a quarter starts ignoring all alerts including the ones that matter. A few rules that hold up:
- Page only on real customer impact. If the alert does not require waking someone up, it should be a daily digest, not a notification.
- Use sustained-failure thresholds. A single missed check from a single region is not an outage; three consecutive failures from two regions usually is.
- Suppress noise during deploys. Most monitoring services let you mute checks during a deployment window.
- Tier your alerts. Critical (page someone), warning (Slack channel), informational (weekly email).
- Review and tune monthly. Alerts that fire constantly without action either need to be tuned or deleted.
Google's Site Reliability Engineering book is the single best reference on this, and despite being written for hyperscale systems, the principles transfer cleanly to a small business setup.
What Small Looks Like in Practice
For a typical service business website, a workable stack looks like this:
- Uptime: Better Stack or UptimeRobot, free tier, monitoring three or four URLs with 5-minute checks. Email and one push notification per check failure.
- Errors: Sentry on the front end and the API layer, free tier, alerts for new error types and for spikes in existing ones.
- RUM: Search Console for the official Google number, plus whatever the hosting platform offers. Reviewed monthly, not daily.
- Status page: Optional. A simple Better Stack or Instatus page if you want to be ready when something breaks.
- Logs: Whatever the hosting platform provides. You do not need a log aggregation pipeline.
Total cost: zero to fifty dollars a month. Total setup time: a few hours. Total ongoing attention: a 15-minute weekly skim and a deeper monthly review.
That is enough to catch the things that actually matter and ignore the things that do not.
When to Add More
The decision point for upgrading the monitoring stack usually comes when one of three things happens:
- The site has real users depending on uptime in a time-sensitive way. Booking systems, ecommerce, anything where a 30-minute outage is a real revenue event.
- You ship custom application code on a regular cadence. Then error monitoring shifts from "nice to have" to "essential" because you are introducing new failure modes constantly.
- You depend on third-party integrations that fail in ways the user blames you for. Then you need API-level monitoring of those dependencies as well.
This is the territory where we typically build custom internal software and where the website care plans we run start incorporating proactive monitoring as part of the standing scope.
Translating Monitoring into Business Conversations
The most useful thing a monitoring stack gives you is not the alerts; it is the data you can quote when someone asks how the site is doing.
- Uptime over the last 90 days. "We were up 99.97% for the last quarter, with one 12-minute incident on March 14 caused by a registrar configuration change."
- Top error types. "The contact form fails for users on a specific Safari version about 0.3% of the time. We have a fix scheduled."
- Core Web Vitals trends. "LCP on the top 10 landing pages improved from 3.4 seconds to 2.1 seconds over the last three months."
Those sentences are how you have an honest conversation with a marketing partner, a client, or a board, instead of guessing. They are also how you spot a problem that is creeping up before it becomes the kind of incident anyone notices in real time.
What to Do This Week
If your site has no monitoring at all today, the order that delivers the most reassurance per hour:
- Set up uptime monitoring on the homepage and the contact page. Free tier of any major provider.
- Wire up Sentry (or equivalent) to your front end and any server-side endpoints. Free tier.
- Open Google Search Console and confirm the Core Web Vitals report is populated. If it is not, your tracking code or site verification needs attention.
- Define one notification channel and one escalation path. Email yourself for non-critical, push or SMS for critical.
- Schedule a monthly 30-minute review on the calendar. The review is what makes the rest of it work.
Monitoring is one of those investments where the cost is small and the payoff is invisible right up until the moment it is enormous. The customer who never wrote in to tell you the form was broken because the form never broke for them is the entire point.
If you would rather hand the whole thing off and have someone else carry the pager, that is the kind of work our care plans cover, and the contact form is monitored well enough that we will hear about it if it stops working before you do.
More posts from the blog.

Fast Loads, Slow Clicks: Why INP Is the Performance Metric Business Owners Should Care About
A plain-English guide to Interaction to Next Paint (INP): why fast-loading pages can still feel broken, what causes slow clicks, and how to fix the interactions that cost leads.

Accessibility Overlays Are Not a Compliance Plan: What Business Owners Should Do Instead
Accessibility overlay widgets promise one-line compliance, but real accessibility comes from fixing the website itself: markup, contrast, keyboard support, forms, content, and testing.
Is Your Website Ready for AI Agents? Booking, Quotes, Forms, and Service Pages in 2026
AI agents will expose weak website workflows. Here is how service businesses can make booking, quotes, forms, service pages, and contact paths ready for human and AI-assisted buyers.
Keep reading?
More field notes from building modern websites and software for real businesses.