Measuring Website ROI: The Metrics That Matter (and the Ones That Distract)
How to measure real website ROI: pipeline-attributed revenue, qualified leads, CAC, and the GA4 plus CRM stitch. Plus the vanity metrics worth ignoring.
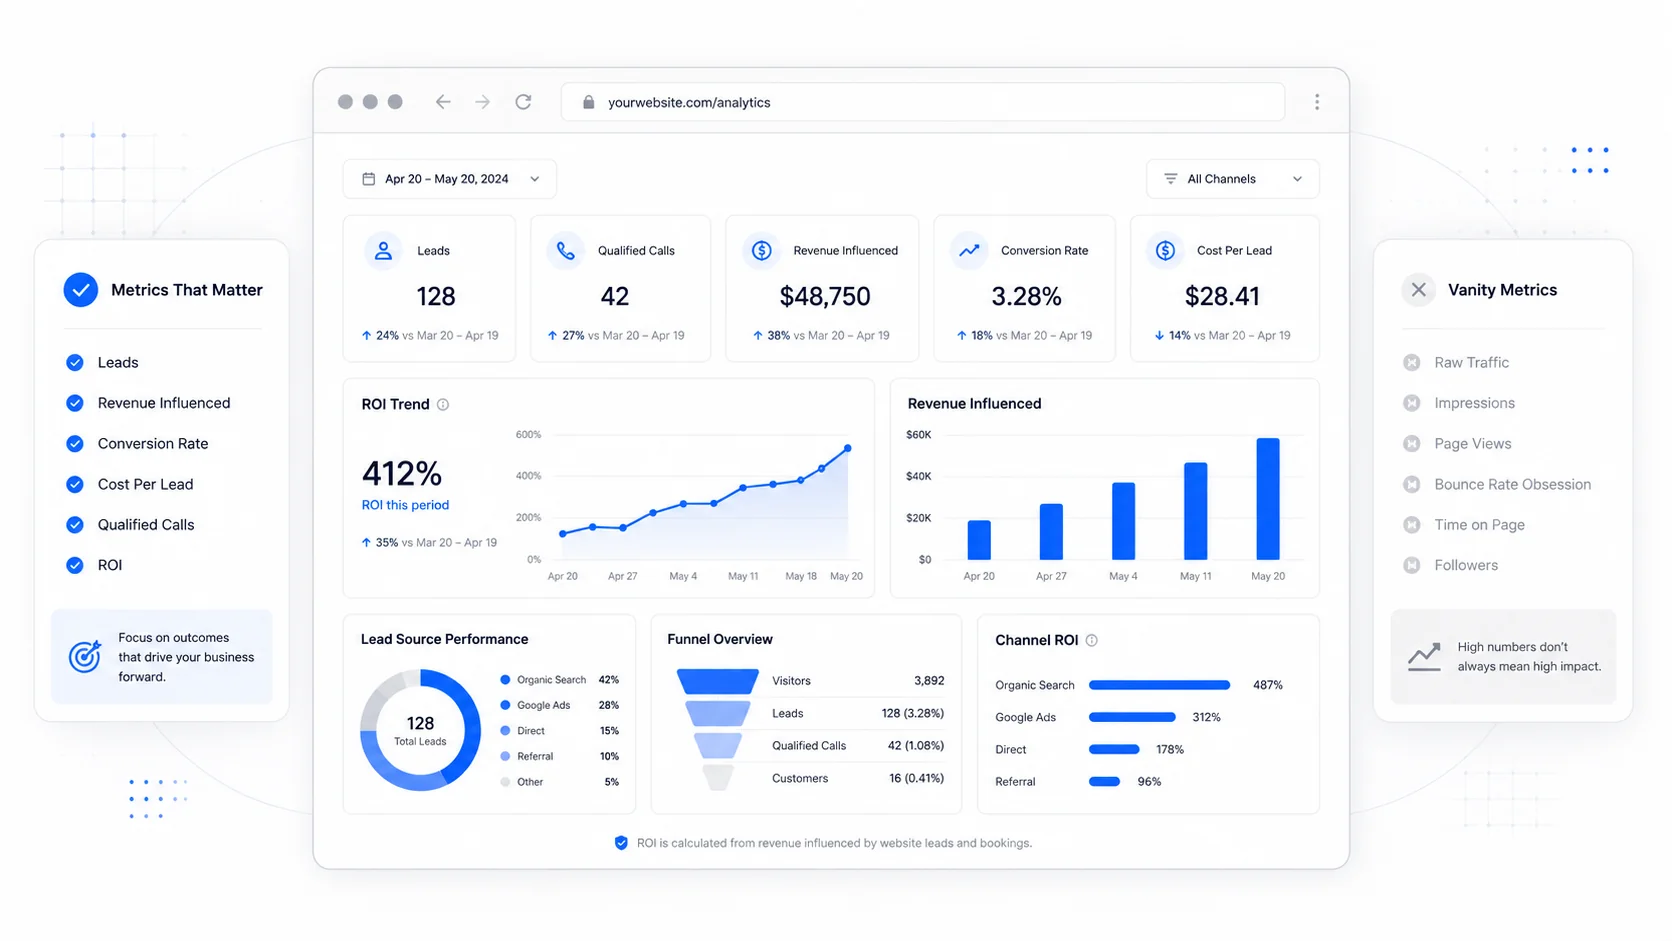
Most small businesses have a website analytics dashboard. Few of them have a clear picture of what the website is actually contributing to revenue. The dashboard tells them sessions are up. It does not tell them whether the sessions are turning into customers, what those customers are worth, or whether the marketing dollars going into the site are coming back out as profit.
The gap between "we have analytics" and "we know what the site is worth" is where most marketing budget gets wasted. This post is about closing that gap with a small set of metrics that actually answer the ROI question, and about the vanity numbers worth ignoring even though every dashboard shows them by default.
Why Most Website ROI Reporting Is Wrong
The fundamental problem is that website analytics tools were built to measure traffic, not money. Google Analytics knows when a person landed on a page. It does not know whether that person eventually paid you $4,800 four months later for a service contract. The website tool sees the front of the funnel. The CRM and accounting system see the back. Until you connect them, you are guessing.
A good summary of the problem is in HBR's piece on marketing measurement that matters: the metrics most teams report are the ones easiest to collect, not the ones tied to enterprise value. The same dynamic plays out at small business scale. Sessions are easy to report. Pipeline contribution is hard to report. So pipeline contribution gets ignored.
This is the gap to close.
The Metrics That Actually Matter
There are five numbers that, taken together, tell you whether your website is worth the money you are spending on it. Everything else is supporting detail.
1. Pipeline-Attributed Revenue
This is the single most important number. It answers: of the revenue we closed in the last 90 days, how much can be traced back to a website session?
To calculate it honestly, you need three things:
- A way for the website to capture a unique identifier when a lead converts (typically an email address from a form submission, or a phone number from a click-to-call).
- A way to push that identifier into your CRM.
- A way to mark, in the CRM, when that lead becomes a customer and at what value.
GA4's data import feature and measurement protocol both support this. Most modern CRMs (HubSpot, Pipedrive, Salesforce, Close) have native or third-party integrations that close the loop. The technical lift is real but one-time.
Once you have the pipe wired up, the number falls out: total closed-won revenue from contacts who originated as a website conversion, in a defined window. That number, divided by the total marketing spend on the site (build amortized over its expected life, plus hosting, plus care, plus paid traffic), is your real website ROI.
Forrester's B2B revenue research consistently finds that companies who measure pipeline-attributed revenue (rather than session counts) make better budget decisions and grow faster. The reason is simple: they are optimizing for what produces money.
2. Qualified Leads, Not All Form Submissions
Not every form fill is a lead. A real lead is someone who matches your ideal customer profile, has expressed interest in something you actually sell, and has the budget to pay for it. Everything else is noise.
The discipline is to define the qualification criteria up front. A typical small service business might define a qualified lead as:
- The contact provided a real business email or phone number.
- The contact requested a service you offer in a market you serve.
- The contact indicated a project budget or timeline that is within range.
- The contact passed any spam filters and was not a competitor or a vendor pitch.
Track qualified leads weekly, not just total submissions. The ratio of qualified to total tells you whether your forms are attracting the right traffic. If 80 percent of your form fills are spam or out-of-market inquiries, you have a targeting and copy problem, not a volume problem. Our piece on conversion patterns that actually convert covers how to fix this at the form layer.
3. Customer Acquisition Cost (CAC) by Channel
This is the cost to acquire one paying customer through each channel. It separates the channels that work from the ones that just show up on the dashboard.
The formula:
- Total fully-loaded cost of the channel in a period (ad spend + tools + portion of staff time + portion of website cost) divided by the number of new customers acquired through that channel in the same period.
Run it separately for organic search, paid search, paid social, referrals, direct, and email. The channels with the lowest CAC, adjusted for the value of the customers they bring in, deserve more investment. The channels with the highest CAC are candidates for cuts.
McKinsey's marketing efficiency research shows that small businesses who calculate CAC by channel out-perform those who do not by a meaningful margin, mostly because they stop spending on channels that are visibly underperforming. The number forces honesty.
4. Lifetime Value to CAC Ratio (LTV:CAC)
LTV is the total gross profit a customer produces over the entire relationship. LTV:CAC is the ratio of that to what it cost to acquire them.
A healthy LTV:CAC for a small service business is 3:1 or higher. Below that, you are spending too much to win customers relative to what they pay. Above 5:1, you are probably under-investing in growth and could spend more aggressively.
The ProfitWell research on LTV and the Bain & Company customer economics work both walk through how to calculate this in detail. For a service business, the simple version: average revenue per customer per year times average years retained, times gross margin, divided by CAC.
If your website is the largest source of new customers, LTV:CAC at the channel level tells you whether the website is paying for itself or burning capital.
5. Time From First Touch to Closed Customer
This is the metric that prevents premature judgment. A website that does not produce revenue in the first 30 days is not necessarily failing. It might just be in the middle of a 90-day sales cycle.
Track the median time from first website session to closed customer. For most B2B services, it is 30 to 120 days. For consumer services, it is often the same day or within a week. Once you know the typical cycle, you can read short-term reports correctly: a quiet 30 days might mean nothing, or might mean the top of the funnel just stopped working.
The Pew Research consumer behavior data on how people make purchasing decisions consistently shows that even simple service decisions involve multiple touches over multiple days. Optimizing for "first session converts to customer" misunderstands how people actually buy.
The Vanity Metrics Worth Ignoring
The metrics that look impressive on a dashboard are usually the ones that distract from the question of money.
Sessions and users. Useful as a denominator. Useless as a goal. A site can double sessions and produce zero additional revenue if the new sessions are the wrong people. Optimizing for sessions invites the kind of traffic that does not buy.
Bounce rate. GA4 redefined bounce rate to mean "sessions that did not engage," which is closer to useful than the old definition, but still a poor proxy for revenue. A 70 percent bounce rate on a clear, single-purpose landing page is fine if 4 percent of the engaged sessions become customers. The GA4 documentation on engagement explains the new definition.
Average session duration. A long session is not better than a short one. A short session that ends in a phone call is the best possible session. A long session where someone bounces around looking for an answer they cannot find is a sign of confusion, not interest.
Page views. Identical problem to sessions. More page views from the wrong audience is not a win.
Social shares and follower counts. These belong on a separate report about brand reach. They are not website ROI metrics. Connecting them is a category error that wastes meeting time.
"Time on page." This metric is so noisy it is almost actively misleading. Browser tabs, idle visitors, and ad blockers all distort it. Drop it from the executive report.
Anything ending in "score." Lighthouse score, SEO score, page experience score. These are useful as diagnostic tools for the team doing the work. They should not be on a leadership dashboard. The dashboard should show pipeline.
How to Stitch GA4 to Your CRM
The technical work to connect website analytics to revenue is the part most small businesses skip. It is not as hard as it sounds.
The pattern that works for most service businesses:
- Capture a stable identifier on form submission. Email address is the most common. Push it into a hidden field that GA4's user-ID feature can read.
- Send the form submission as a GA4 event with the email (hashed, for privacy) as a parameter. Send the same event to your CRM via webhook.
- In the CRM, when the contact converts to a customer, set a "closed-won" stage with the deal value.
- Use a GA4 BigQuery export or a tool like Supermetrics to join GA4 sessions to CRM outcomes by the email identifier.
- Build one dashboard, in the tool of your choice, that shows pipeline-attributed revenue by source per month. That is the revenue dashboard.
For most businesses on a custom build, we set this up at launch as a baseline, because retrofitting it later is much harder than building it in.
If you are running paid media, also enable GA4's Google Ads conversion import so the ad platform optimizes against actual revenue rather than form submissions. This single change often improves paid efficiency by 20 to 40 percent because the algorithm starts feeding the ads to people who buy, not just people who fill out forms.
A Reporting Cadence That Works
The temptation is to look at analytics every day. Resist it. Daily reports invite reaction to noise.
A better cadence for a small business:
- Weekly: qualified leads count, top 5 landing pages by conversion, any anomalies (a sudden spike or crash). 15-minute review.
- Monthly: pipeline-attributed revenue by source, CAC by channel, conversion rate by top template. 60-minute review with marketing and sales together.
- Quarterly: LTV:CAC by channel, content investment versus return, decision on what to keep funding and what to cut. 90-minute review with leadership.
The HubSpot reporting research finds that businesses who report monthly outperform those who report weekly on revenue impact, mostly because the longer cadence forces them to look at outcomes instead of activity.
When to Bring in Help
If your CRM and analytics are not talking to each other, or if your reports are full of session counts but light on revenue, the lift to fix it is usually a few days of work, not a few months. We handle this as part of marketing automations and integrations, often paired with a refresh of the underlying tracking on the site.
The ROI of doing this well is not subtle. A small business that goes from "we get a lot of traffic" to "we know which $1 of marketing spend produces $7 of revenue" usually shifts budget within 90 days, and the budget shift produces visible growth within two quarters. It is one of the highest-leverage projects a marketing team can run.
Action Items
If you want a real picture of website ROI by next quarter:
- Pick the five metrics above. Drop everything else from your leadership report.
- Define what counts as a qualified lead, in writing, and share it with sales.
- Wire GA4 to your CRM by email identifier. Use the BigQuery export if you have the budget.
- Calculate CAC by channel for the last 90 days. Calculate LTV for your top customer segment.
- Build one dashboard that shows pipeline-attributed revenue, monthly, by source.
- Set the cadence: weekly leads, monthly pipeline, quarterly investment review.
The goal is not more numbers. The goal is the right numbers, looked at on the right cadence, by people who can actually act on what they show. A small business with five accurate metrics will out-decide a competitor with fifty inaccurate ones, every time. If you would like help building this out for your business, get in touch through our contact page or browse past projects to see how we set up tracking on builds we have shipped.
More posts from the blog.

The 2026 Website Content Refresh Playbook: Updating Old Pages Without Breaking SEO
A practical content refresh process for small business websites: how to update stale pages, preserve rankings, improve AI search visibility, and avoid SEO mistakes.
The AI Chat Widget Decision: When It Helps Leads and When It Hurts Trust
AI chat widgets can qualify leads and answer common questions, but they can also slow the site, invent answers, mishandle privacy, and damage trust. Here is how to decide.
Fast Loads, Slow Clicks: Why INP Is the Performance Metric Business Owners Should Care About
A plain-English guide to Interaction to Next Paint (INP): why fast-loading pages can still feel broken, what causes slow clicks, and how to fix the interactions that cost leads.
Keep reading?
More field notes from building modern websites and software for real businesses.