Why Your Website Is Slow (and the Real Cost of Doing Nothing)
Why most small business websites are slow — render-blocking resources, third-party tags, hydration, server response — and what slowness actually costs in conversions.
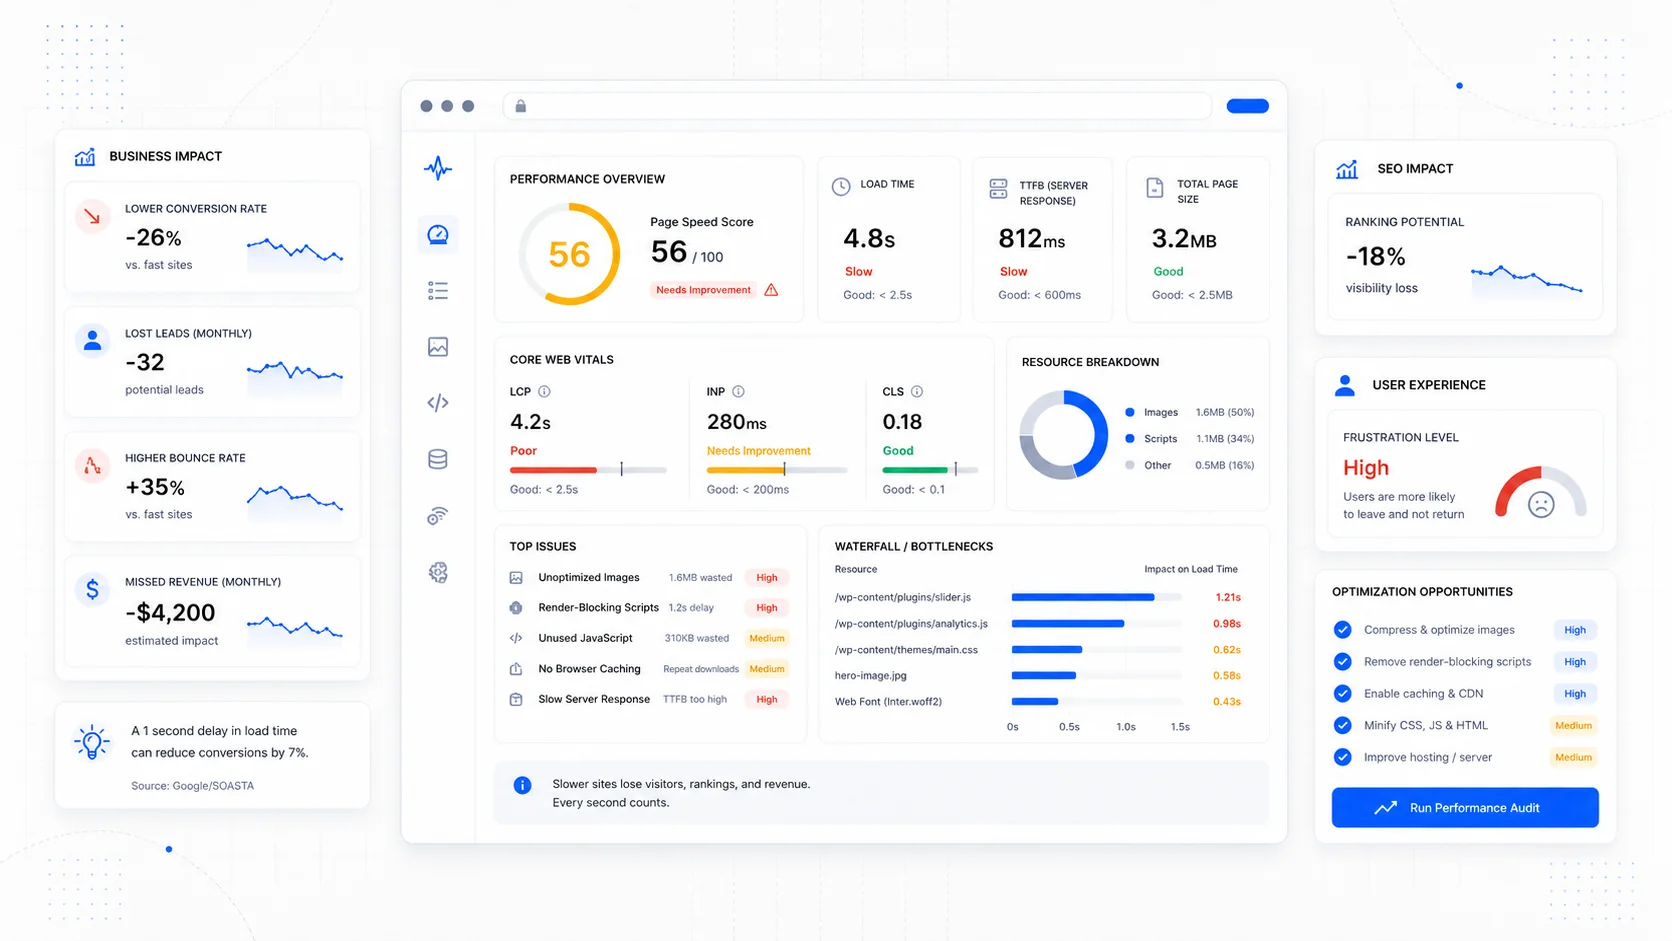
Almost every owner who tells us their website is slow has the same first question: how slow is it actually, and how much is it costing them? They are right to ask both. A site that takes a second longer to load than it should is not the end of the world. A site that takes five seconds longer is bleeding revenue every day, and most owners have never been shown the math.
This post walks through why small business sites get slow, what the underlying causes usually are, and what the documented impact of slowness is on conversion. It is the conversation we have at the start of every conversion-focused design engagement, and the reason performance is part of every site we ship.
What "Slow" Actually Means
When most people say their site is slow, they mean one of three things:
- The page takes a long time to show anything at all.
- Something appears quickly but the page jumps around or feels unfinished for several more seconds.
- The page looks done but does not respond when they tap or scroll.
Those map almost cleanly to the three Core Web Vitals: Largest Contentful Paint, Cumulative Layout Shift, and Interaction to Next Paint. Google grades sites at the 75th percentile of real Chrome users, which means if one in four visitors has a bad experience, the site is failing — even if the average looks fine.
The thresholds for "good" in 2026:
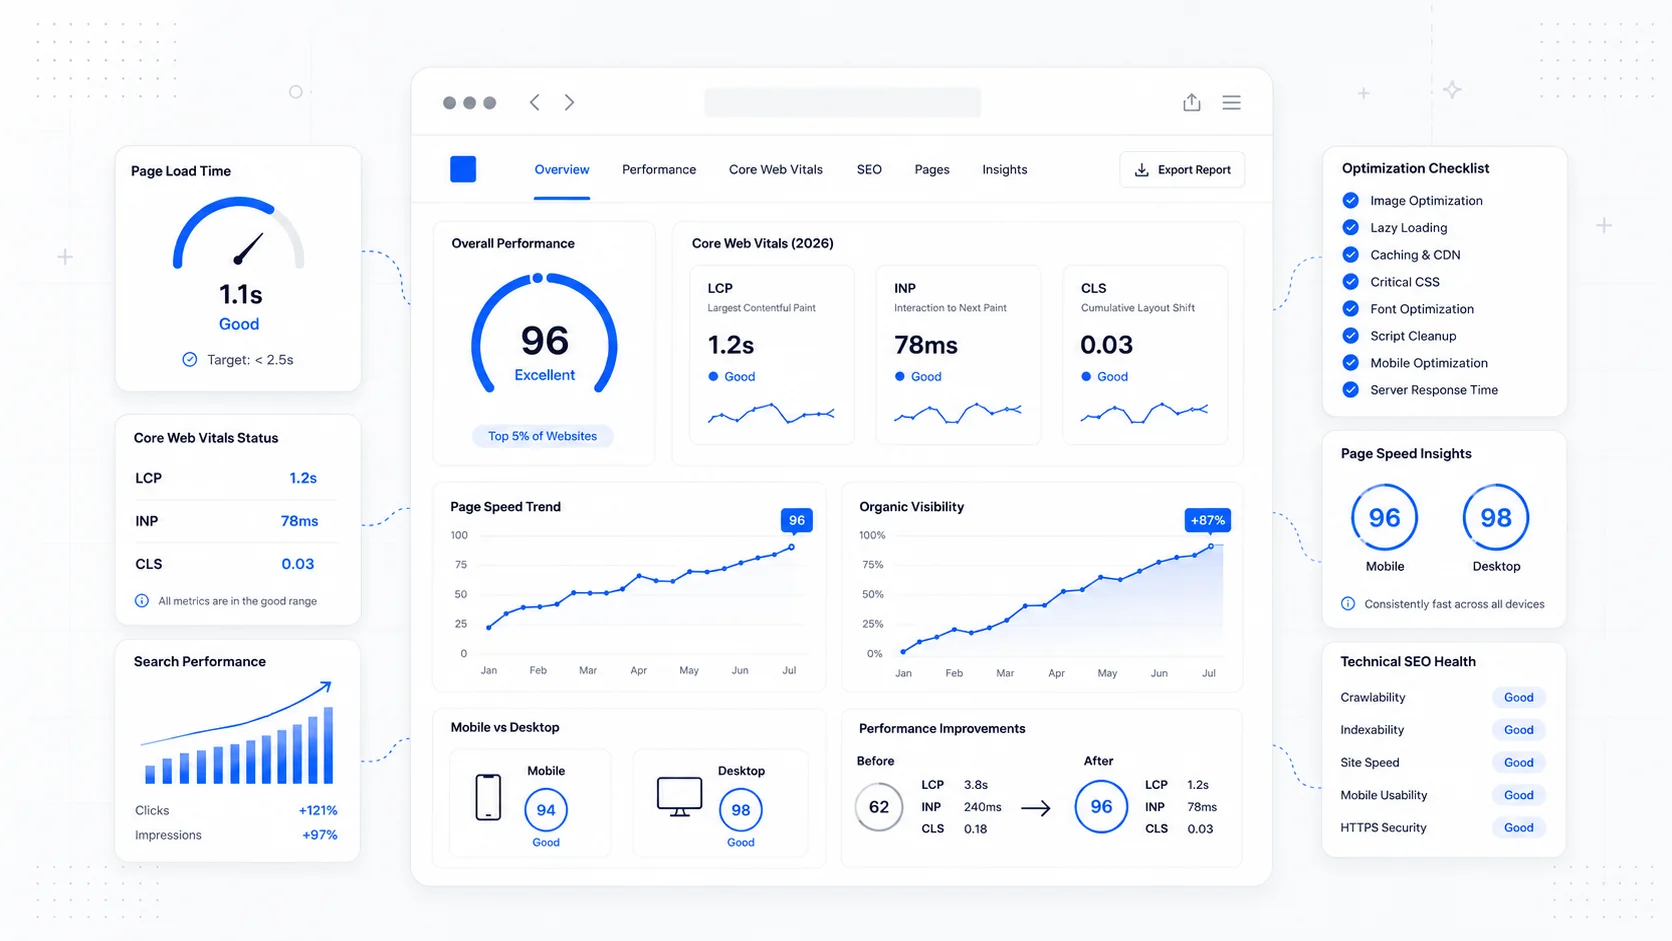
- LCP at or below 2.5 seconds.
- INP at or below 200 milliseconds.
- CLS at or below 0.1.
You can pull your own numbers from the Chrome User Experience Report (CrUX), Google Search Console's Core Web Vitals report, or PageSpeed Insights for any URL. Lab tools like WebPageTest tell you why those numbers look the way they do.
The Real Causes of a Slow Small Business Site
When we open up a slow site, the diagnosis is almost always one of the same handful of culprits. The order changes; the names rarely do.
Render-blocking resources
Every CSS file and synchronous JavaScript file in the <head> blocks the browser from rendering anything on screen. A typical neglected site loads three or four CSS files, two or three font files, and a few synchronous scripts before the first pixel paints.
The fixes are well-trodden:
- Inline the critical CSS for the first viewport and defer the rest.
- Use
<link rel="preload">only for resources that genuinely block the render, not as a catch-all "make it faster" charm. - Add
deferorasyncto every non-critical<script>tag in the head. - Self-host fonts and use
font-display: swaporoptional. Hosted fonts from third-party CDNs add a DNS lookup, a TLS handshake, and a render-blocking dependency for no real benefit.
Web.dev's render-blocking resources guide is the most thorough single reference.
Third-party tags
The single biggest performance killer on most small business sites is the marketing stack. Chat widgets, analytics, ad pixels, A/B testing tools, customer data platforms, session replay, heatmaps — each of them is a script downloaded from someone else's server, executed on the main thread, often blocking interaction.
The HTTP Archive's Almanac tracks third-party adoption across the web every year. The pattern is consistent: third parties account for the largest share of main-thread JavaScript execution time on the median page. Most sites use far more of them than they need.
The fix is editorial more than technical: count your third-party scripts and remove anything you have not actively used in the last 90 days. Then defer or load-on-interaction whatever survives. A chat widget can wait until the user clicks the chat icon. Heatmaps can wait until the page is interactive. The marketing pixel does not need to load before the headline.
Slow server response time
Time to First Byte (TTFB) is how long the browser waits for the first byte of HTML from your server. If TTFB is over a second, nothing else matters — every other metric inherits the delay.
Common causes:
- Cheap shared hosting on a server thousands of miles from your visitors.
- A CMS that runs an expensive query for every request because page caching is misconfigured.
- A platform without a real CDN, so every visitor hits the origin directly.
- Server-rendered pages that block on slow third-party APIs.
The web.dev guide to TTFB covers diagnosis and the standard fixes: edge caching, faster hosting, pre-rendered pages, and trimming back synchronous server-side dependencies.
For a marketing site, the right architecture is usually static or incrementally rendered HTML served from a CDN edge. That puts TTFB under 200 ms for most visitors regardless of where they are. The shift from "old WordPress on shared hosting" to "modern stack on edge hosting" is often the single biggest performance win we ship.
Hydration and over-shipped JavaScript
If your site is built on a JavaScript framework, the JavaScript bundle itself is often the bottleneck. The page might render quickly because the HTML is static, but it sits unresponsive while the framework "hydrates" — downloading, parsing, compiling, and executing megabytes of JavaScript before the user can interact.
This shows up in Interaction to Next Paint and Total Blocking Time. The fixes:
- Use server components or static rendering for content that does not need interactivity.
- Code-split aggressively. The page should not download the JavaScript for the checkout flow when the user is on the homepage.
- Avoid hydrating large interactive components for content that is essentially static (a marketing FAQ, a service page).
- Audit your dependencies. A single chart library or animation library can add hundreds of kilobytes.
Web.dev's INP guide and the framework's own performance docs (for Next.js, Astro, etc.) cover the patterns.
Oversized images
Images are still the largest share of bytes on the median page. We have a whole post on image optimization, so I will keep this short: ship the right format (AVIF or WebP), the right size for the device, with width and height attributes set, and fetchpriority="high" on the LCP image. That single set of changes often moves LCP by a full second or more.
Layout shift
Cumulative Layout Shift is the metric where structural sloppiness shows up. Every image without dimensions, every late-loading ad, every web font that swaps in and reflows the text — they all add up to a page that feels like it never settles.
The fix is mechanical: reserve space for everything before it arrives. MDN's CLS reference and the layout-shift API documentation cover the details.
What Slow Costs in Conversion
This is the part most owners have not been shown directly. The data on speed and conversion is consistent across two decades of research.
A few of the well-cited numbers:
- Google's research on mobile site speed found that as mobile page load time increases from 1 to 3 seconds, the probability of bounce increases by 32%. From 1 to 5 seconds, bounce probability increases by 90%.
- Cloudflare's analysis of real-world web performance data has repeatedly tied better Core Web Vitals to higher conversion rates and lower bounce rates across industries.
- The widely cited Walmart performance work — covered in SOASTA's case studies and several follow-ups — tied each second of load time improvement to measurable conversion lift.
- The HTTP Archive's State of the Web tracks the steady upward creep of page weight and the corresponding pressure on Core Web Vitals.
For a small service business, the math gets concrete fast. If your site brings in 10 leads a month at the current speed, and you are losing 20% of mobile visitors to bounces caused by slow loading, you are leaving roughly two leads on the table every month. At a service business's typical lead-to-customer ratio and lifetime value, that is real money — usually well into the five figures annually.
The other cost is harder to measure but real: every slow page erodes trust. A customer who waits eight seconds for your contact page assumes the rest of your operation is similarly disorganized. They are often right.
How to Diagnose Your Own Site in 30 Minutes
You do not need a performance consultant to get a credible read on your site. Spend half an hour:
- Run PageSpeed Insights on your homepage, your top service page, and your contact page. Note both the field data (real users) and the lab data (simulated test).
- Open the same URLs in WebPageTest on a 4G mobile profile. Look at the waterfall — what loads first, what blocks rendering, where the gaps are.
- In Chrome DevTools, throttle to "Slow 4G" and "4x CPU slowdown," then load the page. That approximates a mid-range Android on a typical mobile connection.
- Open Google Search Console's Core Web Vitals report and identify any URL groups marked "Poor" or "Needs improvement."
- Count your third-party scripts. List them. Mark which ones you actually use.
That diagnosis will tell you which of the categories above is actually the problem on your site. Most sites have two or three of them, and one usually dominates.
What's Worth Fixing First
If you are looking at a real, slow site and wondering where to start, the order that almost always delivers the most improvement per hour:
- Compress, resize, and convert hero images. Set
fetchpriority="high". - Audit and remove unused third-party scripts. Defer or async-load whatever survives.
- Add
widthandheightto every image and reserve space for embeds. - Move to a host with edge caching if you are still on shared hosting in a single region.
- Self-host fonts and add
font-display: swap. - If you are on a JavaScript framework, audit your dependencies and code-split aggressively.
The first three are usually free and take an afternoon. The rest take longer but are the difference between a site that scores in the 70s and a site that genuinely feels fast.
The Cost of Doing Nothing
The honest answer to "what does it cost to leave it alone?" is that it depends on traffic. A site getting 100 visits a month from local searches will not see a meaningful absolute lift from performance work. A site getting 10,000 visits a month with a 2% conversion rate is leaving real money on the table every month it stays slow.
The cleaner question is whether you can afford the engineering time. For most small business sites, a focused performance pass is one to three days of work. If your site sells anything — leads, bookings, products — that work usually pays back inside a single quarter. We bake it into every SEO-focused build for that reason.
If you would rather have someone else handle the diagnosis and the fixes, start a conversation and we will pull real numbers from your live URLs before quoting anything. The first read is always free, and it is usually the most useful 30 minutes a slow-site owner has spent in months.
Speed is one of the few investments where the user, the search engine, and your conversion rate all want the same thing. The cost of doing nothing is rarely zero. It is just invisible until you measure it.
More posts from the blog.

The 2026 Website Content Refresh Playbook: Updating Old Pages Without Breaking SEO
A practical content refresh process for small business websites: how to update stale pages, preserve rankings, improve AI search visibility, and avoid SEO mistakes.
The AI Chat Widget Decision: When It Helps Leads and When It Hurts Trust
AI chat widgets can qualify leads and answer common questions, but they can also slow the site, invent answers, mishandle privacy, and damage trust. Here is how to decide.
Fast Loads, Slow Clicks: Why INP Is the Performance Metric Business Owners Should Care About
A plain-English guide to Interaction to Next Paint (INP): why fast-loading pages can still feel broken, what causes slow clicks, and how to fix the interactions that cost leads.
Keep reading?
More field notes from building modern websites and software for real businesses.